

The Everything Guide to Business Scorecards: Recruiting Scorecard
This post is part of a series for HR professionals and workplace leaders on business scorecards. Here, we’ll talk about recruiting scorecards and share templates at the end of the post.
What is a Recruiting Scorecard?
If a company’s operational effectiveness is driven by a balanced scorecard, then it follows that many other functional areas within an organization also have scorecards that align to the high-level goals of the organization. For a talent acquisition team, that’s the recruiting scorecard.
In a 2018 podcast with Jason Hopkins, formerly Director of Talent Acquisition and Internal Marketing at Emerus Holdings and current Head of Employer Global Brand at Gopuff, we talked about how tools like recruiting scorecards can be elusive. They are essential to have in recruiting for so many reasons, but there are not many examples likely due the time it takes to complete one (very time-consuming) and the fact that they are highly specialized to the business, industry, and specific organizational goals.
Jason said that scorecards are “a portion of some of the things that we’re measuring on our dashboard on a day to day basis as well as workforce planning…our average rec load and our expectations for how many hires each of our recruiters are required to do each month is based upon demand, so we’re partnering with our other portions of HR to understand what attrition is in each market by our critical roles even more so and making sure that we have the right amount of people on the team the right amount of horsepower to handle what the business is asking of us.”
He added, “I’ve broken down how long do we spend sourcing or reviewing candidates, how long do we spend scheduling screenings and performing screenings, how long do we spend coordinating interviews and getting feedback from our hiring managers, and then how much time do we spend on the administrative tasks to get someone ready to actually be hired. Everyone’s different, every role is a little bit different, but it’s a pretty solid guideline of the segments of how much time it takes. So when we’re looking at working with individuals we’re looking at ways to increase our productivity knowing that as the business doubles our team’s not going to double.”
I encourage you to listen to the entire episode (Ep 145 – Recruiting Metrics Drive Business Processes | Workology) because Jason has a lot of experience and insight into reporting metrics to executive leadership and board members, as well as with service level agreements (SLAs).
Your recruiting team already has a dashboard with metrics that track important key performance indicators (KPIs). The recruiter scorecard has data from that dashboard, but tracks individual performance for each recruiter and may include individual performance goals that are not presented in dashboard metrics. However, all metrics on the recruiter’s individual scorecard should originate from and correlate to operational goals.
Recruiting scorecards measure performance related to volume, time, quality and effectiveness. These can be weekly, monthly, and quarterly, and used to drive each recruiter’s annual performance review or rating. The metrics on the scorecards should identify performance success and where recruiters have an opportunity to improve.
What Metrics Are Included on a Recruiting Scorecard?
Depending on the size and complexity of your organization, the recruiting scorecard metrics will vary but will typically come from the same things that you measure on your recruiting dashboard with room for individual assessment. The first step when developing your recruiter scorecard is to establish a baseline for each member of the team and set goals from there.
At the most basic level, the KPIs you’ll want to begin with are: speed, cost, quality, and customer (hiring manager) satisfaction. I recommend starting with some combination of the following:
– Time to hire: The number of days between a candidate’s application and when they accept the job. This measures how long it takes for a candidate to move through your hiring process. The time to hire goals for all key roles should be determined during the scorecard setup, not when the roles become vacant.
– Time to fill: Similar to time to hire, this measures time for the entire hiring process, from job requisition to job acceptance. Measuring time to fill is an important way for recruiters to demonstrate their efficiency. The longer a position goes unfilled, the more productivity will be disrupted, and the more the responsibilities of that job will be distributed to other staff members. By accurately measuring time to fill, you can evaluate the speed of your team’s recruitment processes and provide hiring managers with realistic time frames for filling their vacant positions.
– Submittal to hire ratio: This is an efficiency metric and is a ratio of candidates submitted to hires made. A low submittal to hire ratio means that you are submitting fewer resumes and making more placements, saving your time as well as your client’s time.
– Offer acceptance rate: This is the percentage of offers that are accepted in a certain time period. For example, if a recruiter makes 10 job offers in a month, and six people accept, the offer acceptance rate for the month would be 60 percent. If this percentage is low, it can help identify weaknesses in your recruitment strategy.
– Applicant-to-hire ratio is the ratio of the number of applicants applying for a position to the number of people hired for that position. This is especially important for high-volume hiring (if you need to fill 100 roles for a new location opening, you’ll need a 30 to 1 ratio, or 3,000 applicants for that location). It’s also helpful when considering programmatic ad spend because that is broken down by application.
– Interview-to-hire ratio: This is the number of candidates on average a hiring manager needs to interview in order to make an offer. An average interview-to-offer ratio is about 4.8:1. A good ratio is 3:1 or better. This metric is useful because it also shows the average number of hours spent on interviewing in the hiring process. It also indicates how much time recruiters on your team spend on making a hire.
– Cost per hire is the average amount of money you spent on making a hire. Recruiting departments face constant pressure to reduce cost per hire. Breaking down your cost per hire is an important strategic tool to assess the cost effectiveness and efficiency of your recruiting process, identify areas for improvement, and help guide your recruiting budget.
– Quality of hire is a quantifiable measure of the effectiveness of the recruiting process to hire productive employees. This is the metric that ties into customer (hiring manager, stakeholder) satisfaction. A quality hire can also be reflected in a high retention rate, so also consider tracking the average turnover rate of a recruiter’s new hires within the first year and compare it to the average. This could also be in the form of a simple NPS score where the hiring manager rates the new employee at the 30/60/90 day mark.
– Percentage of hires by need date measures whether managers are getting their needed talent on time by surveying hiring managers and asking them “what percentage of your hires started on or before your needed starting date?” It should be a recruiter’s responsibility to work with hiring managers to identify their “real” need dates. This is also where headcounts and forecasting come in, and our recruiting team should have access to this information as it changes and evolves based on strategic company goals.
Related: Best HR Metrics for Human Capital Management | Workology
Metrics that should not be included in an individual recruiter scorecard:
– Candidate to hire ratio: This is the ratio of the number of applicants applying for a position to the number of people hired for that position. This metric is directly related to your candidate outreach and, while individual recruiters can make an impact on candidate to hire ratio the success of this metric depends heavily on budget, advertising spend and campaign success.
– Fall off rate: In short, fall-offs are no-shows, or the number of candidates that accept an offer, but don’t show up for their first day of work without notice. Because of the churn in the talent marketplace post-COVID, this is happening a lot and it’s a huge source of frustration for employers.
– Source of hire (also called “recruiting source yield) calculates which applicant sources are performing the best across the board, by position and among recruiters. This helps you measure which source is returning the best applicants. Tracking recruiting source yield will help you distribute your hiring resources to the most effective recruiting channels. Calculate this metric by dividing your recruiting source yield by number of applicants from the recruiting source. Use this metric to determine which sources, job boards or websites are most effective for hiring for your business. While this metric should be included in your recruiting dashboard, the success of the source is external and not driven by individual recruiter performance.
Measuring individual KPIs on a scorecard ensures that your recruiters are challenged to continuously progress and understand that the scorecard drives their annual performance rating. Even on small recruiting teams where there may not be as much competition, high performers tend to compete with themselves by scoring higher than they scored previously. Recruiter scorecards also ensure that performance reviews for each member of the team are based on the same KPIs.
Having a recruiter scorecard is also effective by location and or by challenging position so we can see the metrics and how they have changed over time. This also allows us to forecast based on previous turnover and/or for future headcount needs.
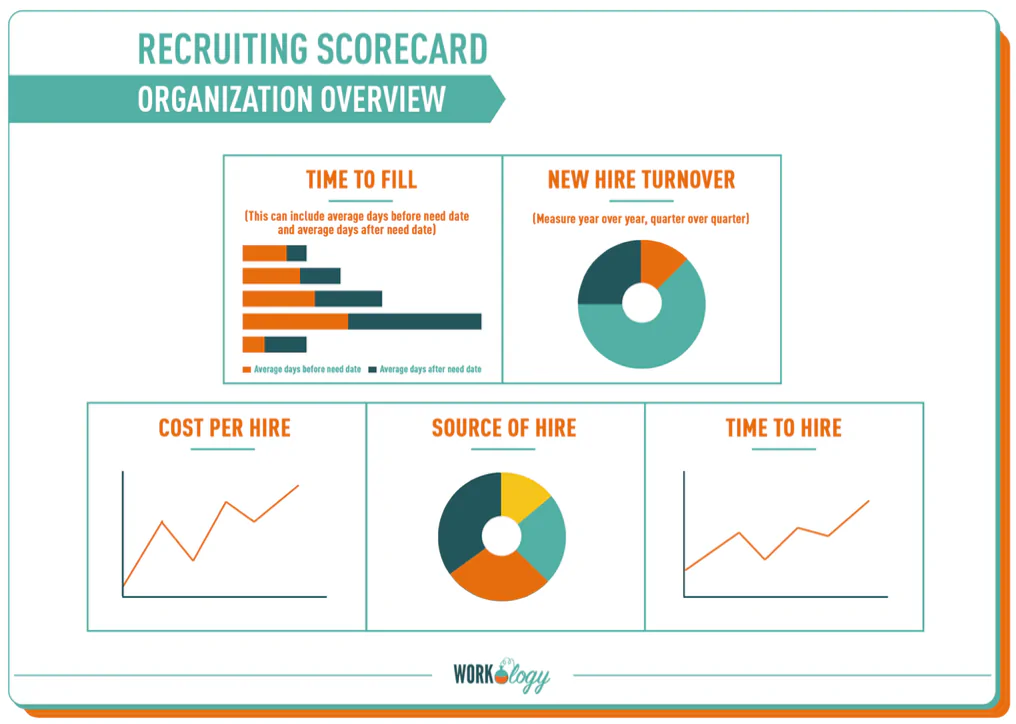
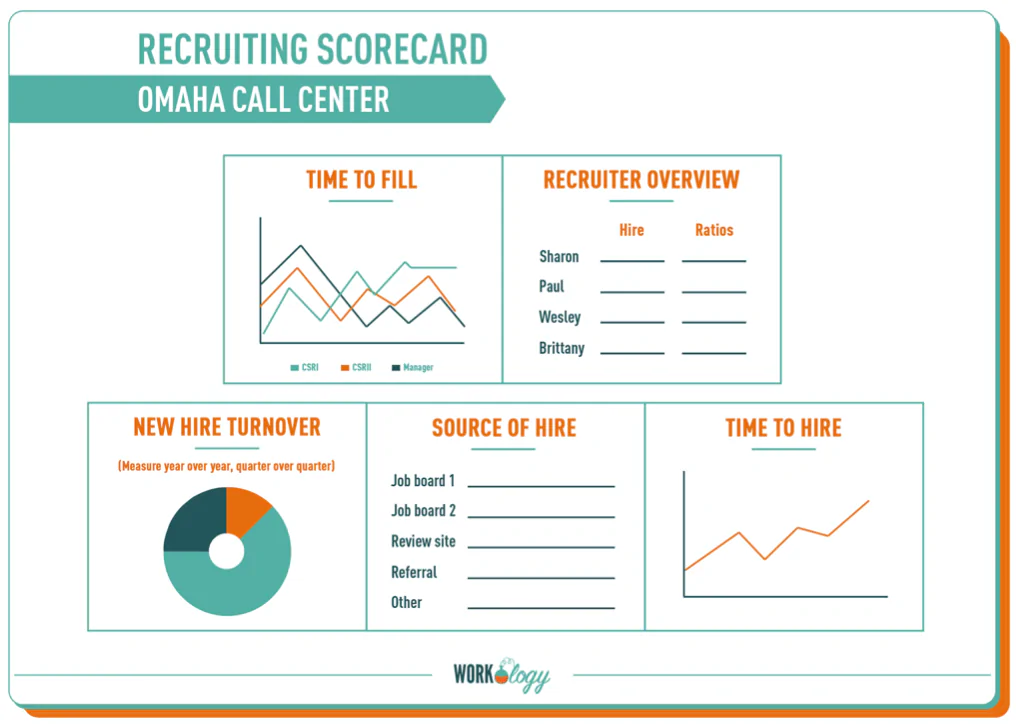
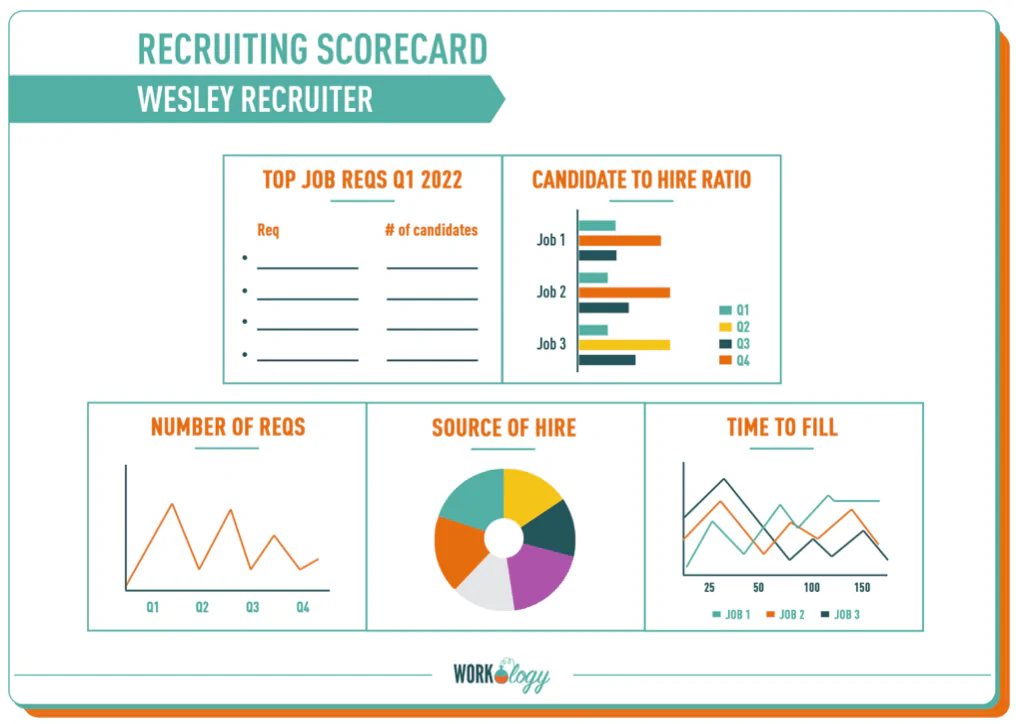
What Does a Recruiter Scorecard Look Like?
What your recruiter scorecards look like depends on the size and structure of your organization, as well as the industry in which you work. Larger organizations will have larger recruiting teams with dedicated recruiters assigned to specific departments or to hard-to-fill positions.
From Dr. John Sullivan: Minimize the number of metrics used – generally there should be a separate metric for these six factors: volume, quality, time, cost, satisfaction, and dollars of business impact. To avoid confusion and overlap, that generally means that there should be no more than 10 metrics in the scorecard. With experience, most find that the number of metrics in the scorecard gets smaller and more refined over time.
“The best recruiters are the ones that have the ability to speak to the organization’s mission and vision while understanding the candidates and what gaps might be existing and how working here can fill those gaps.” – Jason Hopkins, Head of Employer Global Brand at Gopuff.
DOWNLOAD: Recruiter Scorecard Templates: