

HR metrics for human capital management are now central to the business of any public company. Effective November 9, 2020, the Securities and Exchange Commission (SEC) introduced new disclosure requirements designed to provide stakeholders insight into human capital. The new requirements require public companies to disclose the number of employees and a description of human capital resources, along with any human capital measures or objectives. This is a new age of transparency for both investors and talent, and it is likely to drive a lot of conversations between HR or CHRO and company CEOs moving forward.
Best HR Metrics for Human Capital Management
While the new rules do not include a definition of “human capital” or a list of required measures to disclose, we do have the International Organization for Standardization’s (ISO) ISO 30414, human resource management guidelines for internal and external human capital reporting, which provides guidelines on core HR areas such as organizational culture, recruitment and turnover, productivity, health and safety, and leadership.
Here, we’ll review HR metric examples that HR leaders and teams will need to focus on moving forward as companies define SEC disclosure strategies.
Strategic HR Metrics Examples
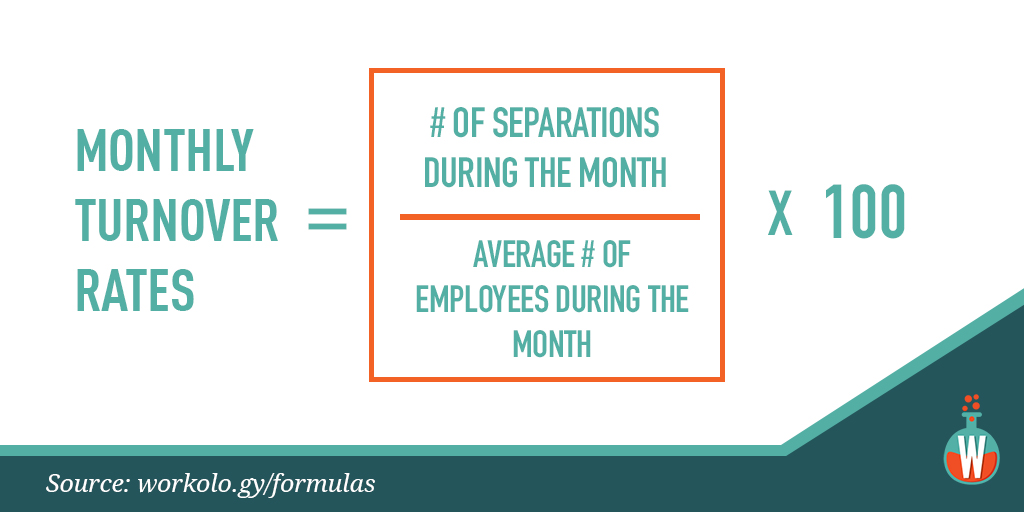
Monthly Turnover Rate
Monthly Turnover Rate = (number of separations during month / average number of employees during month) x 100).
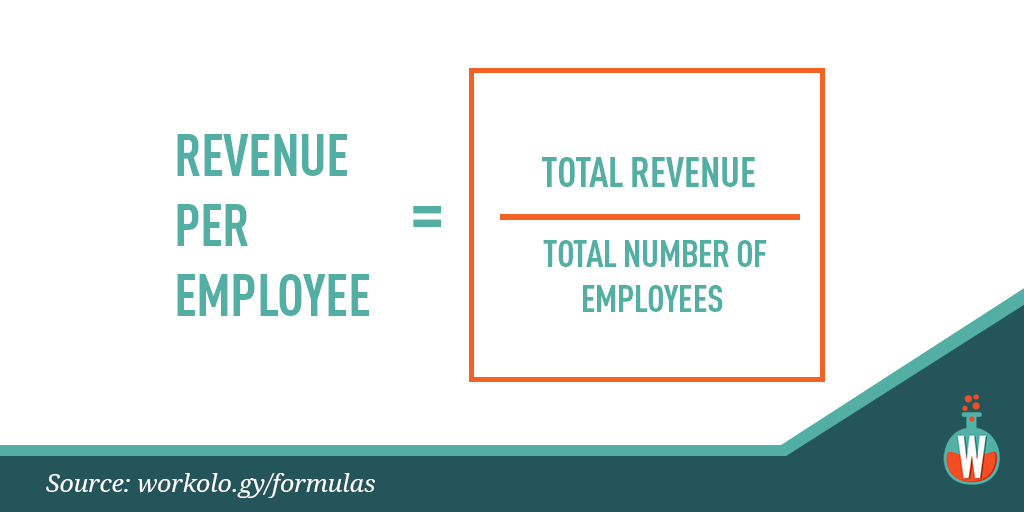
Revenue Per Employee
Revenue per Employee = total revenue / total number of employees. This is especially important when evaluating the cost of a lost employee due to voluntary or involuntary turnover.
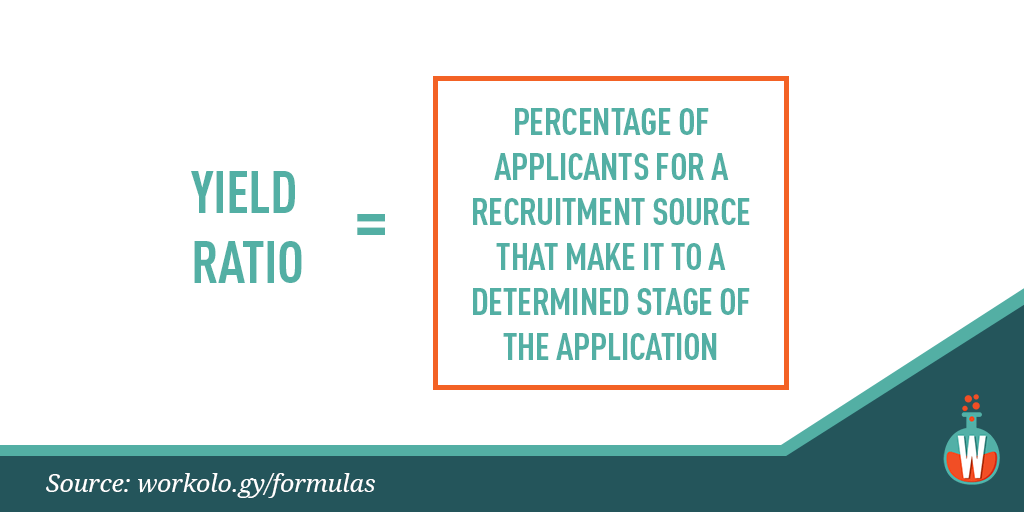
Yield Ratio
Yield Ratio = percentage of applicants for a recruitment source that make it to a determined stage of the application process.
Human Capital Cost
Human Capital Cost = Pay + Benefits + Contingent Labor Cost / Full Time Equivalents.

HR to Staff Ratio
HR to Staff Ratio = Employees / Human Resources Team Members. This ratio is important since during the recession HR departments have reduced in number dramatically. HR serves as the internal customer support staff just like call center customer service employees serve as external facing.

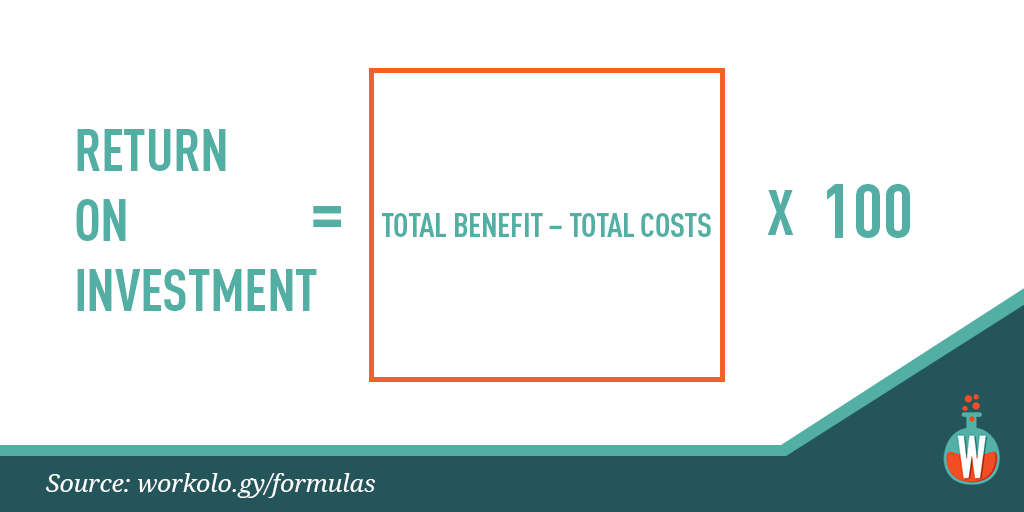
Human Capital Return on Investment
Return on Investment = (total benefit – total costs) x 100.
Promotion Rate
Promotion Rate = Promotions / Headcount. Looking to configure your Headcount? Get Your 5-step Checklist for successful Headcount Planning.

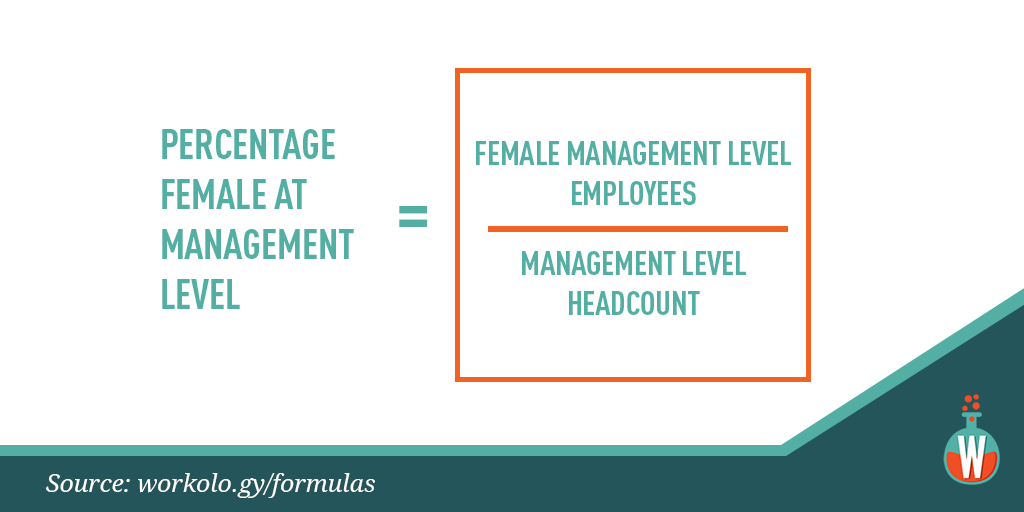
Percentage of Females at Management Level
Percentage of Females at Management Level = Female Management Level Employees/Management Level Headcount. This formula can also be used when evaluating executives at a female level and other diversity categories like veterans and race.
Employee Absence Rate
Employee Absence Rate = number of days in month / (average number of employees during month x number of days). I have used this analysis to look at employee absence rates for different departments and managers. Sometimes the best way to determine if their is a culture or manager opportunity is through evaluating the percentage of absences by department or manager.

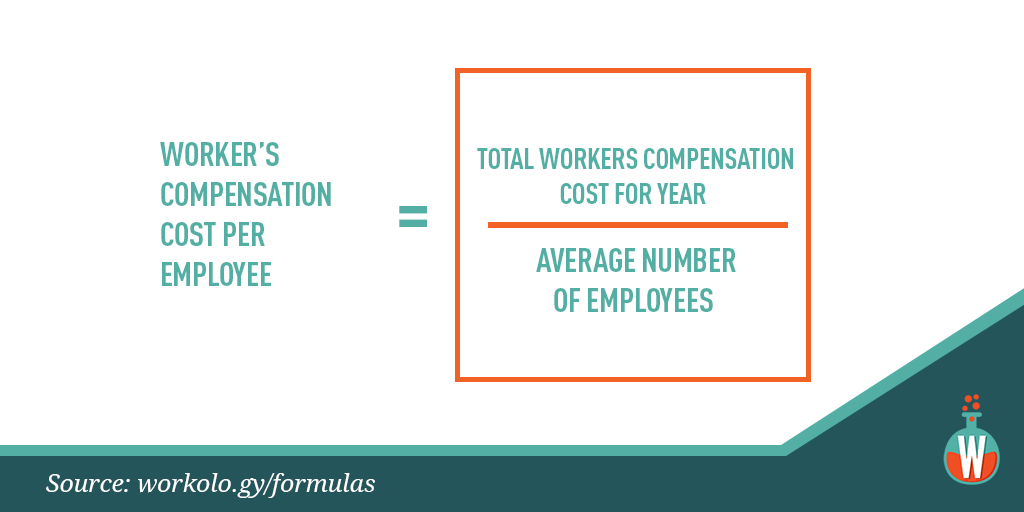
Worker’s Compensation Cost Per Employee
Worker’s Compensation Cost Per Employee = total workers compensation cost for year / average number of employees.
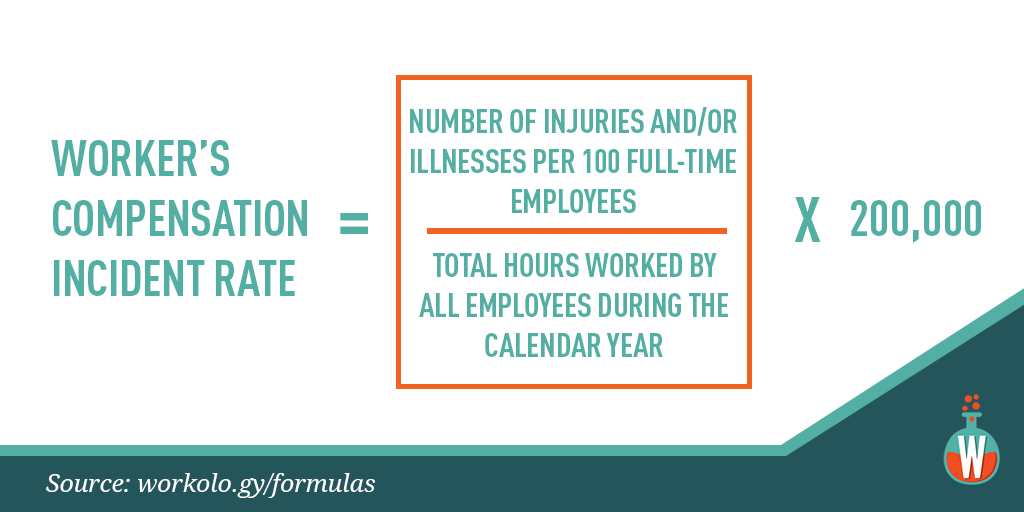
Worker’s Compensation Incident Rate
Worker’s Compensation Incident Rate = (number of injuries and/or illnesses per 100 full-time employees ∕ total hours worked by all employees during the calendar year) x 200,000.
Overtime per Individual Contributor Headcount
Overtime per Individual Contributor Headcount = Overtime Hours/Individual Contributor Headcount.

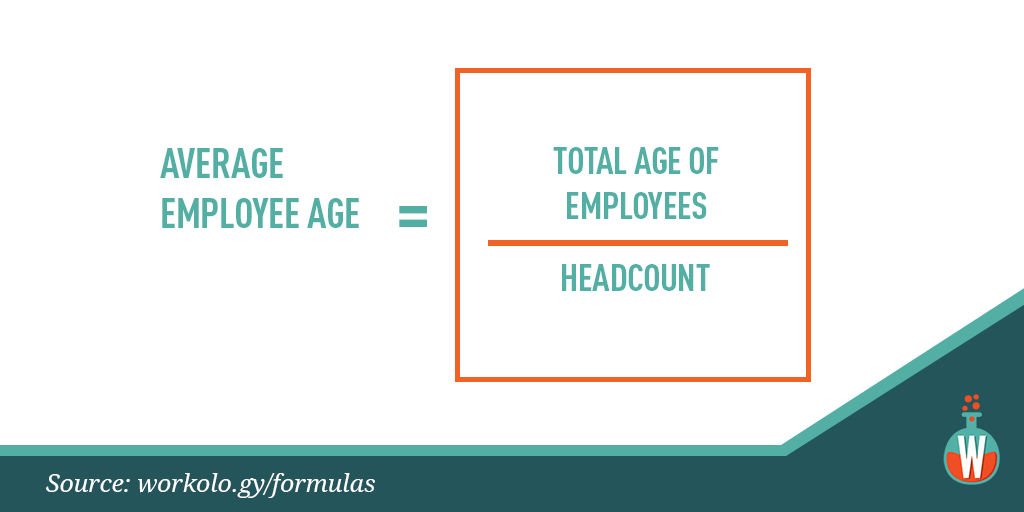
Average Employee Age
Average Employee Age = Total Age of Employees / Headcount. This is an important metric in my mind when looking at succession planning and forecasting staffing areas of opportunity as older workers begin to consider retirement. Also, an important metric when calculating benefits costs for your organization.
Time to Fill
Time to Fill = Calculate your average time to fill by adding all time to fill measurements for each position you filled in a given period (e.g. a year) and then divide by the number of roles.
Acceptance Rate
Acceptance Rate = The number of jobs offers your organization extends divided by the number of candidates who accept an offer.

Retention Rate
Retention Rate = Divide the number of employees that remained in your organization over a given period by the number of total employees.
Retention Rate per Manager or Team
Retention Rate per Manager or Team = The retention rate broken down by individual managers or teams.
Training Cost per Employee
Training Cost per Employee = The total cost of your organization’s training courses and programs divided by the total number of employees.
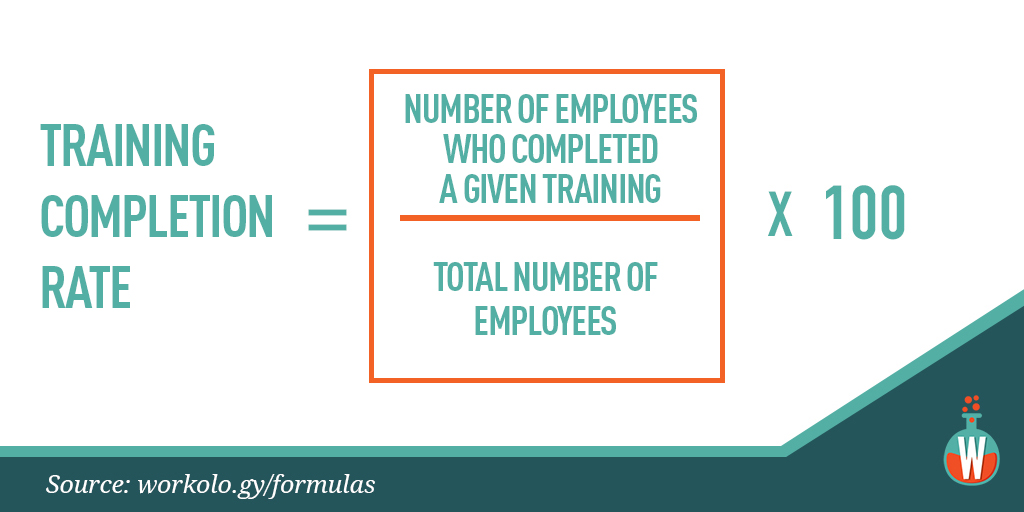
Training Completion Rate
Training Completion Rate = The number of employees who completed a given training divided by the total number of employees, then multiplied by 100 to get a percentage.
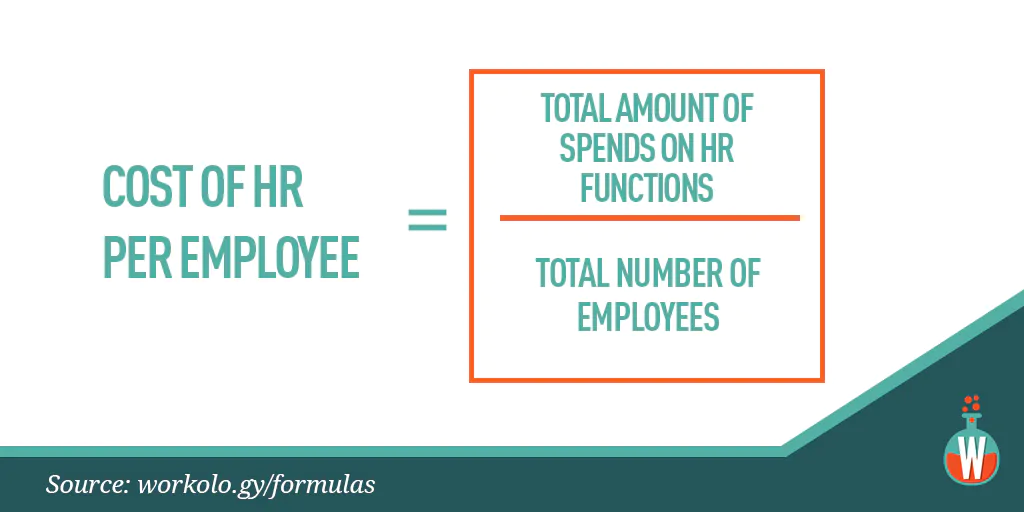
Cost of HR per Employee
Cost of HR per Employee = The total amount your company spends on HR functions divided by the total number of employees.
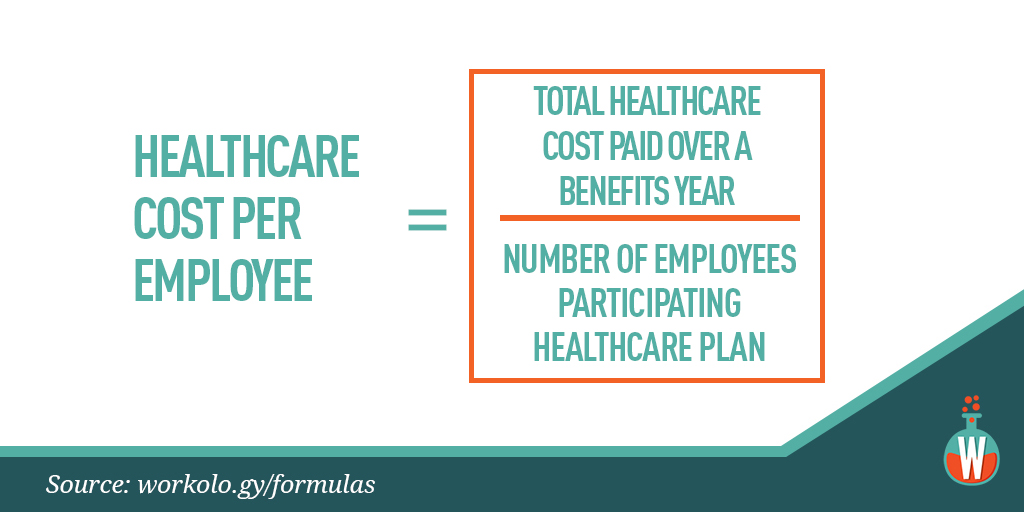
Healthcare Cost per Employee
Healthcare Cost per Employee = Total healthcare cost paid by your company over a benefits year divided by the number of employees participating in your healthcare plan.
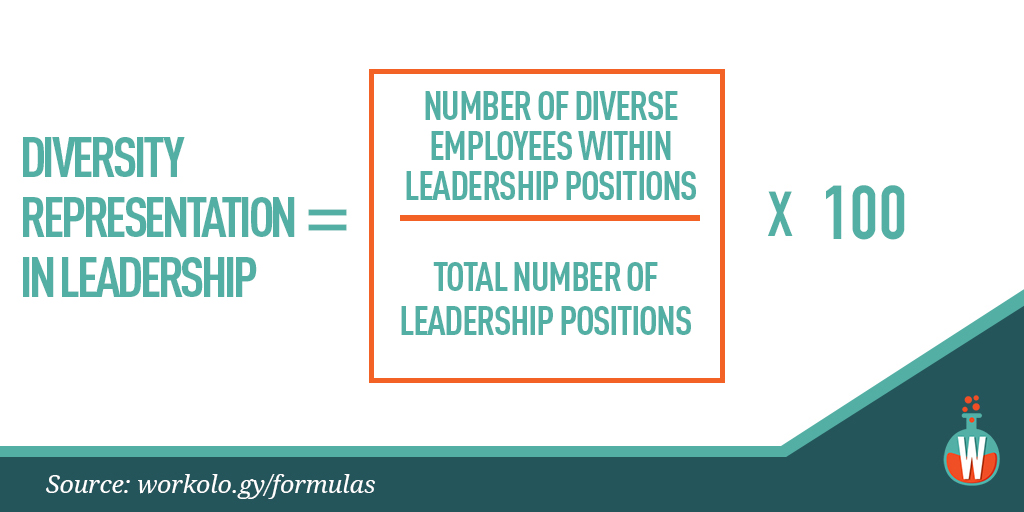
Diversity Representation in Leadership
Diversity Representation in Leadership = The number of diverse employees within leadership positions divided by the total number of leadership positions, multiplied by 100 to get a percentage.
Employee Engagement/Net Promoter Score (NPS)
Employee Engagement/Net Promoter Score (NPS) = A survey asks employees: “How likely is it that you would recommend working at our company to a friend or colleague?” The question is answered on a scale from 0 to 10, with anyone answering 0 to 6 considered a detractor, 7 and 8 considered passive, and 9 to 10 respondents considered promoters.
Calculate your NPS by subtracting the percentage of detractors from promoters.
A negative score indicates that more employees said they would not recommend someone to work at your company, whereas a positive score indicates high levels of engagement, with more people recommending your company as an employer of choice.
Why HR and Human Capital Metrics Matter
Some people call leveraging metrics as part of your HR strategy an evidence-based HR practitioner. I like to think of it as a smart organizational business partner who specializes in workplace analytics to drive these type of business decisions. Part of being a well-rounded human resource professional who has the entire organization in mind when developing people strategy and other HR programs uses metrics, examples, analytics, and formulas to determine a program’s success, or as part of any type of analysis, SWOT included.
HR will be expected to develop a plan along with company leadership for metrics and disclosure strategies, and taking the lead on this now can prevent you from scrambling for information in coming months. These metrics can help give you a starting point to begin conversations with stakeholders about what HR metrics your company will need to track, monitor and disclose.
Are there any metrics you use on a regular basis that I may have missed? Leave a comment below, and let’s start a conversation on how you leverage HR metrics as part of your human resource and recruitment department.
If you’d like to automatically get these metrics calculated for you with compensation management software, click here.


23 Comments
The posted “Return on Investment” formula is incorrect.
ROI = (Gain from Investment – Cost of Investment)/(Cost of Investment)
The “x 100” only applies when expressing ROI as a percentage. ROI is frequently expresses as a multiplier – e.g. “3.7 x” or “3.7 times” rather than as 370%.
Note: ROI does not consider the time value of money or any uncertainties, as to the the costs or benefits and, consequently, can overstate the attractiveness of an investment.
[email protected]
Hi Richard,
Thanks for the information. I will research and take a look. Outside of the CPH metric there are no standards for the HR industry.
JMM
Jessica,
You’re welcome.
The right set of metrics can bridge between CEO/C-suite perspectives and enterprise talent management practices, to directly connect TM initiatives and people manager behaviors to strategic outcomes.
There’s plenty of upside (i.e. >10x ROI) available in every company — through the application of systematic processes that cut deleterious employee expenses (e.g. turnover, employee theft, workplace accidents, etc.), while boosting performance (e.g. productivity, innovation, employee engagement, customer loyalty, talent access/retention, etc.).
As Peter Drucker noted: “What’s measured improves.” Some rather common metrics like “Time to Hire” and “Cost per Hire” have no strategic value, whatsoever.
[email protected]
Hi Richard!
With ROI for HR it is not so easy. HR tend to ignore the alignment of its actions with an ultimate strategy goal of the company.
One of the possible approaches that I believe might work is to use strategy map and the balanced scorecard to establish this alignment. Then quantifying and measurement will be much easier: http://www.bscdesigner.com/calculate-a-talents-roi-to-improve-all-hr-kpis.htm
Interesting info. As a former HR professional, I can say that you have covered a lot of basis in your article. When it comes to overtime, also good to calculate standard vs. time and a half OT pay. Good info!
Denise Turney
Author – Love Pour Over Me
http://www.chistell.com
Although it does not represent a “standard” metric, I believe it’s important to capture and report Efficiencies Achieved, or Cost Savings as a result of HR operations, particularly when reporting on a change in operational procedures.
For example, if you make a change from external to internal recruiting, you report Recruiter Fee Savings Realized vs the Manpower Costs to provide those services in-house. This can be cumulative for the year vs previous year or previous method, or can be reported as a separate costperhire comparison metric. (( If you make a change the other direction, and spend more money, be prepared to find the positive metric – reduced time-to-fill, or improved manager-satisfaction-with-quality-hires, or something positive. If you look at it and can’t find ANY positive, that’s a sign to reverse direction, and at least report that the hypothesis failed, but lessons were documented and learned.))
Likewise, if you invest resources in a significant change in your “benefits shopping due diligence”, and achieve a significantly lower rate for the same level of benefits, or hold the line on rates but achieve more benefits for the employees, then this should be reported as well.
Ditto for Workers compensation insurance negotiations, safety efforts, training costs, etc.
If you are activily seeking changes and cost reductions, you need to report these accomplishments in the metrics of other C-team members. These may not be on-going on a consistent manner, but I would rather report 3 or 4 big “wins” than 12 months of less significant trends.
Everything we do for savings, goes straight to the bottom line ( well, almost “straight to” according to my previous CFO), so Capture the data on these Wins and publicize it at the Executive meeting !
Good post. This is a nice set of basic Human Resources Metrics.
One favorite HR metric of one of our clients is ‘Regrettable Turnover’ (measuring how many people left the organization that were deemed to be effective or high potentials, taking into account performance ratings, peer and manager endorsements, 9-box reviews, etc).
please i want to know if what are the hr metrics we shoud meassure as an organization
I would not under ANY circumstances make it a practice to include the age of employees in any reporting mechanism. Coming across this in discovery claim would be a plaintiff lawyers dream.
Meant to say …Coming across this information in age discrimination case during discovery would be a plaintiff lawyers dream.
Hello everyone. Our company is planning to get into H.R Analytics. can somebody help me how should I go about it in the initial stages. What factors to consider while developing metrics etc.?
It might be a good idea to establish the work priorities for positions before diving into metrics especially when supervisors have no in depth knowledge about the functions in those positions and how they contribute to the total mission of the organization.
Thank you for the information, would also like to know the metrics for employee training & development
Hi Naglaa,
I’ll see what I can do for you.
JMM
Using a metric to report on EE population age group is an acceptable practice, if the information is used to inform overall employee engagement, recognition and reward, and overall retention. This metric is very important in today’s diverse environment.
Hello what about the recruitment rate ? is there any formula to calculate it ?
Hi Hanea,
Let me look into that for you and get back.
JMM
May someone share with me the exact formula to hire additional strength against relievers, leaves, gazetted holidays. how much additional strength we can hire?
Hi Guys,
Thank you for this article. What I want to know (hopefully someone can shed some light on this) is the metrics that top organizations (Google, Facebook, Alibaba, etc.) make use of?
Currently doing some research and your answer/s will be much appreciated. Perhaps you can also re-direct me to a website that can generate this type of report.
Or is identifying someone and interviewing him the best way?
Thanks!
Regards,
Mark Soriano
Hello just wanted to give you a brief heads up and let you know a
few of the pictures aren’t loading correctly. I’m not sure why but I think
its a linking issue. I’ve tried it in two different
web browsers and both show the same outcome.
Awesome!
Thank you Jessica,
I am Prashanth John from India, I teach HRM for graduate level ,quite interested in HR Metrics can you suggest any reference text books in this HR metrics area ,it would be a great help .Thank you for the post it itself have a lot of info.Thank you.
Hi Prashanth,
Thank you for the comment. I have several podcast interviews that are more current than HR textbooks on the topic of HR metrics and the changing reporting requirements globally and also by the SEC. I’m linking to them for you below:
https://workology.com/episode-284-human-capital-metrics-sec-reporting/
https://workology.com/episode-266-making-sense-of-human-capital-iso-standards/
Best, JMM
Comments are closed.