

The August jobs report fell short of expectations but the news wasn’t all bad. The American economy added 151,000 jobs last month — not quite the 180,000 economists predicted. Unemployment held steady at 4.9%, labour participation at 62.9% and employment-population ratio at 59.7%. However, wage growth lost the progress seen in previous months, dropping to 0.12%.
Let’s Talk Labour Statistics for Labour Day
Revisions this month were minor. The BLS revised June growth from 292,000 to 271,000 jobs added, and the July report from 255,000 to 275,000. That’s a change of only 1,000 jobs between the two months. These revisions make the new average job growth over the last 3 months 232,000.
The Basics
There were no significant changes to big numbers: unemployment rate, marginally attached workers, or labour participation. Aside from the number of jobs added — and where they were added — there is little to report about the overall employment picture. It remains about in the same shape as it has for months now. That has many economists talking about the US soon reaching full employment.
- Nonfarm payroll job growth: +151,000
- Unemployment: 4.9%
- Labour participation: 62.9%
- Employment-population ratio: 59.7%
- Involuntary part-time workers: 6.1 million
- Marginally attached workers: 1.7 million
- Discouraged workers: 576,000
As for specific sectors, there are few surprises here too. Note that mining is still contracting, health care is still growing and that long term employment trends hold true.
- Food services and drinking places: +34,000
- Social assistance: +17,000
- Professional and technical services: +20,000
- Financial activities: +15,000
- Health care: +14,000 (beginning to slow)
- Mining: -4,000
Full Employment?
More and more economists are arguing that the country is coming closer to full employment — and when that happens, hiring naturally slows. But how we judge full employment isn’t entirely impartial or scientific, there are values and theoretical positions at stake in the argument, so economists and other analysts will never completely agree on just what full employment looks like. According to some, who point to that now consistently low unemployment rate of 4.9%, the US has been at full employment for years.
Others, who look at labour mismatches like college graduates doing jobs high school graduates would have previously held, or long term manufacturing workers now employed in low-paying customer service jobs, and say that we’re from from ideal full employment. That is, we’re employed, but not necessarily the way we would like to be, or the way we should be.
Importantly though, the Full Employment and Balanced Growth Act, or Humphrey-Hawkins Full Employment Act, pegged full employment at 4% people 16 to 20 and 3% for people 20 and over. It also set ideal inflation at 4% or lower. At 4.9% we are 0.9% away from the common understanding of what full employment should like in the United states.
Watch Out for Coming Revisions
With every new jobs report comes revisions to the previous report or reports. In addition to the August numbers that dropped on Friday, we also saw revisions to the July numbers. So although August’s report sees a return to the slow-and-steady pattern of earlier this year, we must wait until October to know the full story. And those revisions can be dramatic. The Wall Street Journal points out that the average adjustment to August reports is 71,000 jobs. “Over the last five years, the initial release of August payrolls reports has undershot forecasts by an average of 52,000. They have missed expectations nine out of the last 12 years, according to Deutsche Bank economists, who project an increase in payrolls of 160,000.”
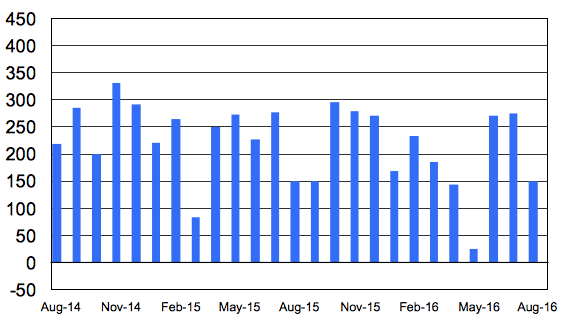
Too, keep in mind that in addition to being difficult to accurately report on, August is, for various seasonal factors, often the slowest month for job creation. The below chart from the BLS on month to month job growth shows that August hiring often dips down but rebounds in September or even October.
As with all jobs reports, we won’t know what this one means until we can compare it to the September data. So I’ll see you again next month for more charts and vague predictions!